


Go-to-market metrics B2B SaaS teams should track
Go-to-market metrics measure whether a company is finding the right market, acquiring customers through a viable motion, converting demand into revenue, retaining accounts, and doing so with acceptable economics. The useful set is not a universal KPI list. It is a small measurement system tied to your current decisions.
Start with the decisions. Which segment should receive more attention? Is the motion creating qualified pipeline? Where does conversion fail? Can the company afford the acquisition cost? Are retained customers growing or shrinking? A metric belongs in the main review only when a named owner can use it to answer one of those questions.
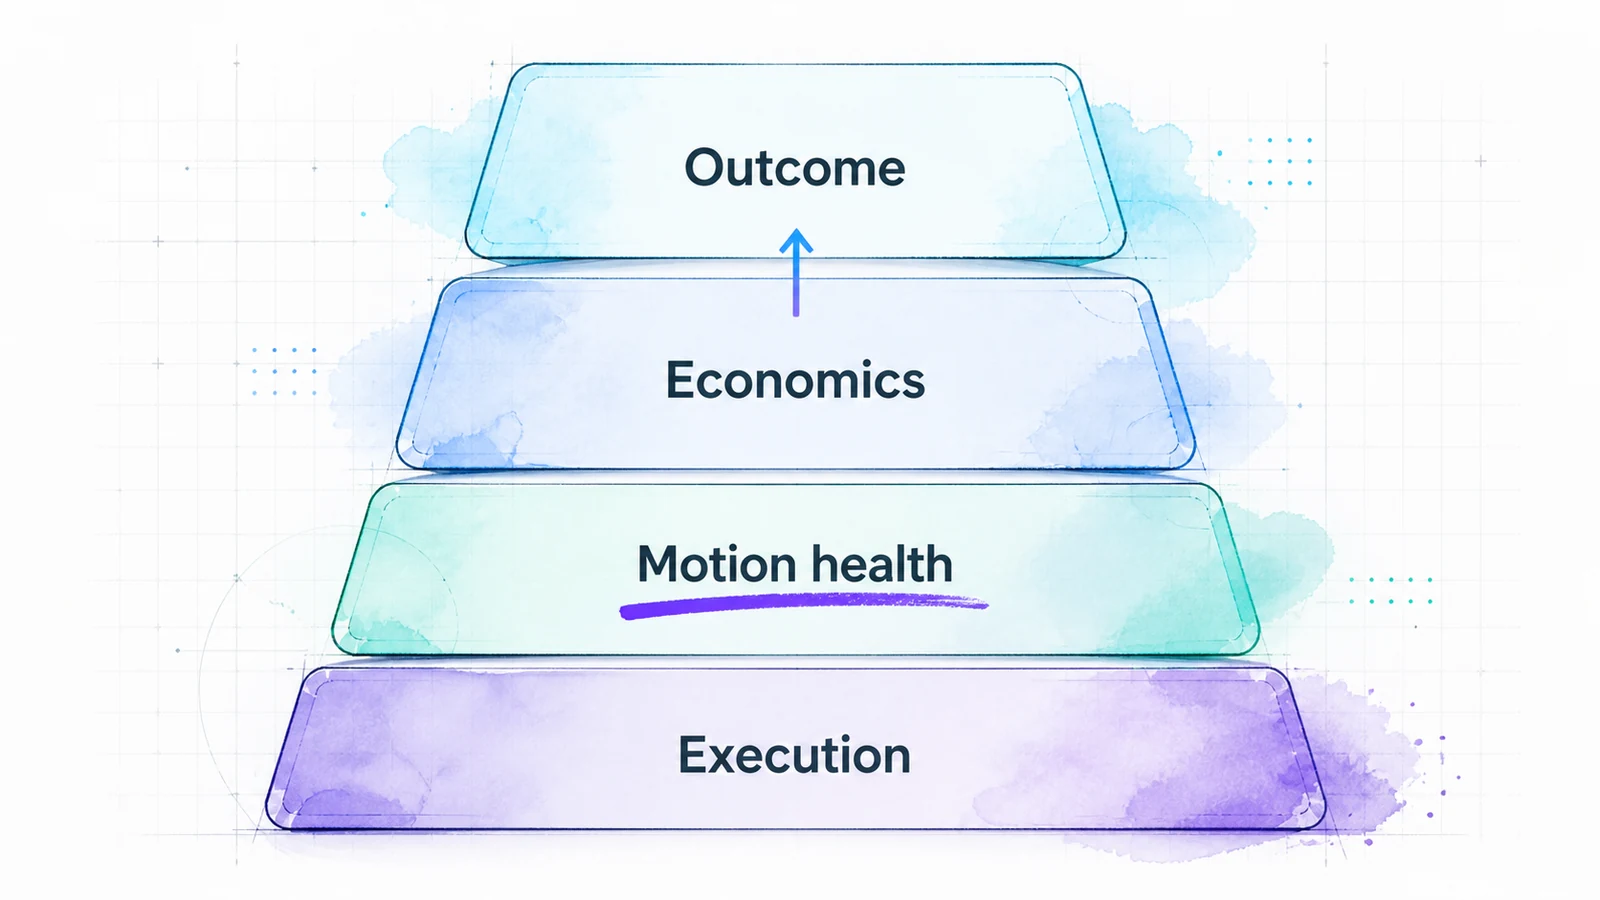
Build a four-layer GTM metric hierarchy
A clear hierarchy keeps company outcomes separate from the inputs that explain them.
1. Outcome metrics
Outcome metrics show whether the business result changed. For a recurring-revenue company, the primary outcome may be net-new ARR, live ARR, or revenue growth. Earlier companies may use retained paying customers or qualified opportunities because revenue is still sparse.
Useful outcomes include:
Outcome metrics are usually lagging indicators. They tell you what happened. They rarely tell you why.
Andreessen Horowitz's B2B startup metric set includes contracted and live ARR, net-new ARR, net dollar retention, gross retention, new logos, ACV, CAC payback, quota attainment, burn, and weighted pipeline. The list remains useful as a map of board-level concerns. Its older benchmark ranges should not be treated as current targets.
2. Economic metrics
Economic metrics test whether growth can continue without consuming unreasonable capital or service capacity.
- CAC
- CAC payback period
- LTV:CAC ratio
- Gross margin
- New-customer CAC ratio
- Expansion CAC ratio
- Burn multiple
Do not compress every motion into one blended number. New-customer acquisition and customer expansion use different inputs, teams, and sales cycles. A blended metric can improve while the underlying acquisition motion becomes less efficient.
Benchmarkit's 2025 B2B SaaS study reported a $2.00 median new-customer CAC ratio and a $1.00 median expansion CAC ratio. Both ratios represent sales and marketing dollars spent per $1 of ARR added. They are not payback periods. The participant mix, ACV, company size, funding, and pricing model affect the comparison.
3. Motion-health metrics
Motion-health metrics show whether the chosen acquisition and conversion model functions as intended.
For sales-led SaaS:
- Qualified sales pipeline
- Stage conversion
- Win rate
- Sales cycle
- Average contract value
- Pipeline coverage
- Forecast accuracy
For product-led SaaS:
- Activation rate
- Time to value
- Trial-to-paid conversion
- PQL rate
- Product adoption
- Self-serve expansion
For partner-led SaaS:
- Activated partners
- Partner-sourced pipeline
- Partner-influenced revenue
- Registered-deal conversion
- Time to first partner opportunity
Motion changes interpretation. ChartMogul's analysis of 2,500 SaaS companies found that B2B companies below $25 average sale price had 20% median new-business ARR growth when they remained self-serve, compared with 0% among those layering sales at that price point. This is a cohort observation, not proof that sales caused the difference. It shows why price and motion belong beside the metric.
4. Execution metrics
Execution metrics locate a specific failure inside the motion:
- Lead response time
- Account acceptance rate
- Discovery-to-opportunity conversion
- Opportunity aging
- Next-step completion
- Onboarding completion
- Feature adoption by cohort
- Expansion-play acceptance
These numbers can change quickly. They are useful for weekly operating decisions but should not become company outcomes. Sending more messages or creating more MQLs is not success if qualified pipeline and revenue remain flat.

Write a metric contract before building a dashboard
Teams often use the same label with different calculations. One group reports booked ARR, another reports activated ARR, and finance reports recognized revenue. The dashboard looks aligned while the underlying definitions disagree.
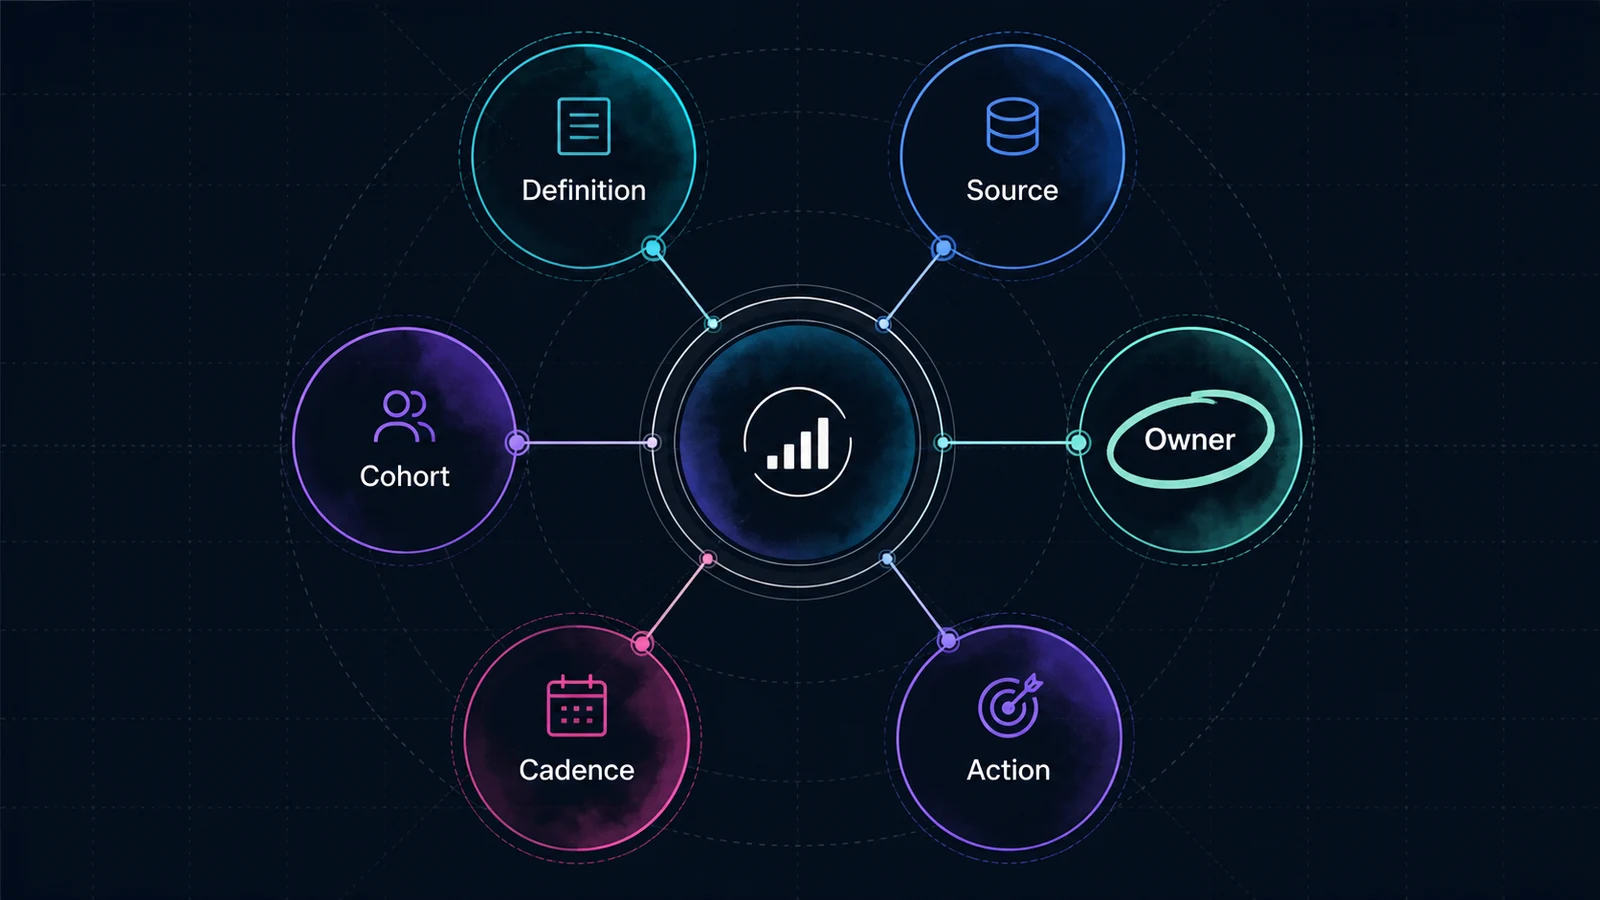
Give every core metric a contract:
| Field | Question |
|---|---|
| Definition | What exactly enters the numerator and denominator? |
| Source | Which system and fields produce the value? |
| Cohort | Which customers, segment, region, or period are included? |
| Owner | Who is accountable for interpreting and changing it? |
| Cadence | When is it reviewed? |
| Action | Which decision changes when the value moves? |
Add unit, time boundary, exclusions, and data-latency notes where needed. A monthly conversion rate should not mix leads created this month with deals closed from older cohorts unless the definition says so.
The owner is not always the person who enters the data. RevOps may maintain the definition and source while sales owns pipeline conversion. Finance may own ARR policy while customer success owns expansion action. The contract separates governance from operating accountability.

Choose metrics for the company stage
The metric set should change as the company learns.
Before a repeatable motion
The main question is whether a specific market has a repeatable problem and will pay for the product.
Track:
- Qualified conversations in the target segment
- Problems repeated across accounts
- Time from first conversation to paid commitment
- Retained paying customers
- Reasons for loss, churn, and non-adoption
- Revenue concentration
At this stage, a polished CAC calculation can create false precision. A founder's time, product effort, and small deal count make the number unstable.
During motion validation
The question shifts to whether a channel and conversion path can produce revenue repeatedly.
Track:
- Qualified pipeline created
- Stage conversion
- Win rate
- Sales cycle
- New-customer ARR
- Activation and early retention
- CAC and payback by channel or segment
Use the go-to-market strategy as the boundary. If the ICP, positioning, price, or sales motion changes, compare cohorts rather than blending results across the old and new model.
During scale
The question becomes whether the company can add revenue efficiently while preserving customer value.
Track:
- Net-new ARR split into new, expansion, contraction, and churn
- Pipeline coverage and forecast accuracy
- CAC ratio and payback by segment
- NRR and GRR
- Quota capacity and attainment distribution
- Gross margin and burn multiple
Scaling adds management layers. It should not remove segment detail. A strong aggregate NRR can hide one shrinking customer cohort. A healthy win rate can hide a falling deal count.
Choose metrics for the GTM motion
Founder-led enterprise sales
Use live ARR, qualified pipeline, stage conversion, win rate, sales cycle, ACV, customer concentration, and implementation status. The founder needs evidence that the same segment and problem can convert without relying on personal relationships alone.
Product-led growth
Use activation, time to value, signup-to-paid conversion, PQL rate, product adoption, expansion, NRR, and support cost. Product activity should connect to account revenue. High activation without paid conversion may indicate weak packaging or low commercial intent.
Outbound sales
Use accepted accounts, positive conversations, qualified opportunities, stage conversion, sales cycle, new-customer ARR, and payback by segment. Delivery and reply metrics help diagnose the channel but should not replace pipeline and revenue.
Hybrid product-led sales
Keep self-serve and sales-assisted cohorts separate. Compare conversion, deal size, sales cycle, support cost, retention, and expansion. A blended conversion rate can conceal whether sales improves larger accounts while adding friction to small ones.
Use leading indicators carefully
A leading indicator should have a demonstrated relationship with a later outcome and arrive early enough to change a decision.
Examples:
- Qualified pipeline can lead revenue.
- Activation can lead retention for a defined cohort.
- Product-qualified accounts can lead sales-assisted conversion.
- Usage near a plan limit can lead expansion.
Do not call an activity a leading indicator only because it happens earlier. Email volume, page views, and meetings are inputs until you show their relationship with qualified pipeline, conversion, or retention.
For retention, Stripe's current NRR guidance keeps expansion, contraction, and churn inside NRR while GRR excludes expansion. Track both. NRR shows how the installed base changes after expansion. GRR prevents a few large upgrades from hiding revenue loss.
Build the review cadence around decisions
Weekly
Review execution and near-term motion health:
- New qualified pipeline
- Stage movement and aging
- Conversion by current stage
- Activation or trial progress
- Blocked handoffs
- Forecast changes
The weekly review should end with owners and next actions, not status narration.
Monthly
Review revenue movement and economics:
- New, expansion, contraction, and churn ARR
- CAC and payback by channel or segment
- NRR and GRR by cohort
- Win rate and sales cycle trends
- Product activation and paid conversion
Monthly data has enough volume for more stable comparisons in many SaaS companies, though small samples still need caution.
Quarterly
Review allocation and strategy:
- Segment performance
- Channel contribution
- Motion economics
- Pricing and package performance
- Capacity and hiring assumptions
- Product adoption and expansion paths
The quarterly review can change the GTM model. Weekly reviews should usually adjust execution inside the current model.
Common GTM measurement mistakes
Tracking every available metric
More metrics create more explanations, not necessarily more clarity. Keep one outcome, three to five drivers, and the diagnostics needed for the current constraint.
Mixing cohorts and periods
Do not compare this month's leads with this month's closed revenue without accounting for cycle length. Follow a cohort or use a clearly defined period model.
Copying benchmarks without context
Benchmarks can help frame a question. They do not replace company stage, ACV, motion, geography, gross margin, and product complexity.
Giving a metric several owners
Several teams can influence a metric. One person should own the review and decision.
Letting the dashboard replace diagnosis
A falling win rate is a prompt to inspect segment, stage, competition, pricing, and deal evidence. The metric is the start of the investigation.
Frequently asked questions
What are go-to-market metrics?
Go-to-market metrics measure whether a company is finding the right market, acquiring customers through a viable motion, converting demand into revenue, retaining accounts, and doing so with acceptable economics. Each metric should support a named decision.
Which GTM metric should a startup track first?
Choose the metric closest to the current constraint. Before repeatable revenue, that may be retained customers or qualified opportunities. Once a motion is repeatable, net-new ARR can become the outcome metric, supported by conversion, cycle, retention, and efficiency drivers.
How many GTM metrics should be on a dashboard?
A core view usually needs one outcome metric, three to five drivers, and a small diagnostic layer. Additional metrics can remain in functional views. The limit is set by whether each number has an owner and a recurring decision.
How do GTM metrics differ for PLG and sales-led SaaS?
PLG emphasizes activation, free-to-paid conversion, PQLs, product adoption, and expansion. Sales-led SaaS emphasizes qualified pipeline, stage conversion, win rate, sales cycle, ACV, forecast accuracy, and payback. Both still need revenue, retention, and efficiency measures.
How often should GTM metrics be reviewed?
Review execution and pipeline weekly, revenue movement and unit economics monthly, and strategy or segment allocation quarterly. Faster review is useful only when the underlying data updates often enough to support a different decision.
Take the metric at the top of your next GTM review and write its definition, source, cohort, owner, cadence, and action. If the team cannot complete all six fields, fix that contract before adding another chart. The SaaS sales funnel guide can help map stage metrics to the conversion decisions behind them.