


NRR
NRR means net revenue retention. It measures how recurring revenue from an existing customer cohort changes over a period after expansion, contraction, and churn.
The standard formula is:
NRR = (starting recurring revenue + expansion – contraction – churn) / starting recurring revenue x 100
Revenue from new customers is excluded. The metric asks whether the customers the company already had became more or less valuable.
Why it matters

New sales can hide weakness in the existing customer base. NRR separates acquisition from retention and expansion so a SaaS company can see whether customers continue receiving enough value to stay and grow.
NRR also shows how much growth the existing base contributes before new customers are added. SaaS Capital's 2025 growth benchmark surveyed more than 1,000 private B2B SaaS companies. Excluding companies below $1 million ARR, median growth was 15% below 100% NRR, 20% at 100% to 110%, 30% at 110% to 120%, 32% at 120% to 130%, and 44% above 130%. The pattern is an association, not proof that raising NRR alone caused higher growth.
NRR above 100% means expansion from existing customers exceeded contraction and churn during the period. NRR below 100% means the cohort lost recurring revenue overall.
The metric connects product value, onboarding, customer success, pricing, adoption, and account expansion. It also has a strong relationship with LTV.
How it works
First, choose a customer cohort and starting period. The cohort must contain only customers active at the beginning.
Second, record the cohort's starting MRR or ARR.
Third, add expansion from upgrades, more seats, usage, or added products.
Fourth, subtract contraction from downgrades and reduced usage.
Fifth, subtract recurring revenue lost through churn.
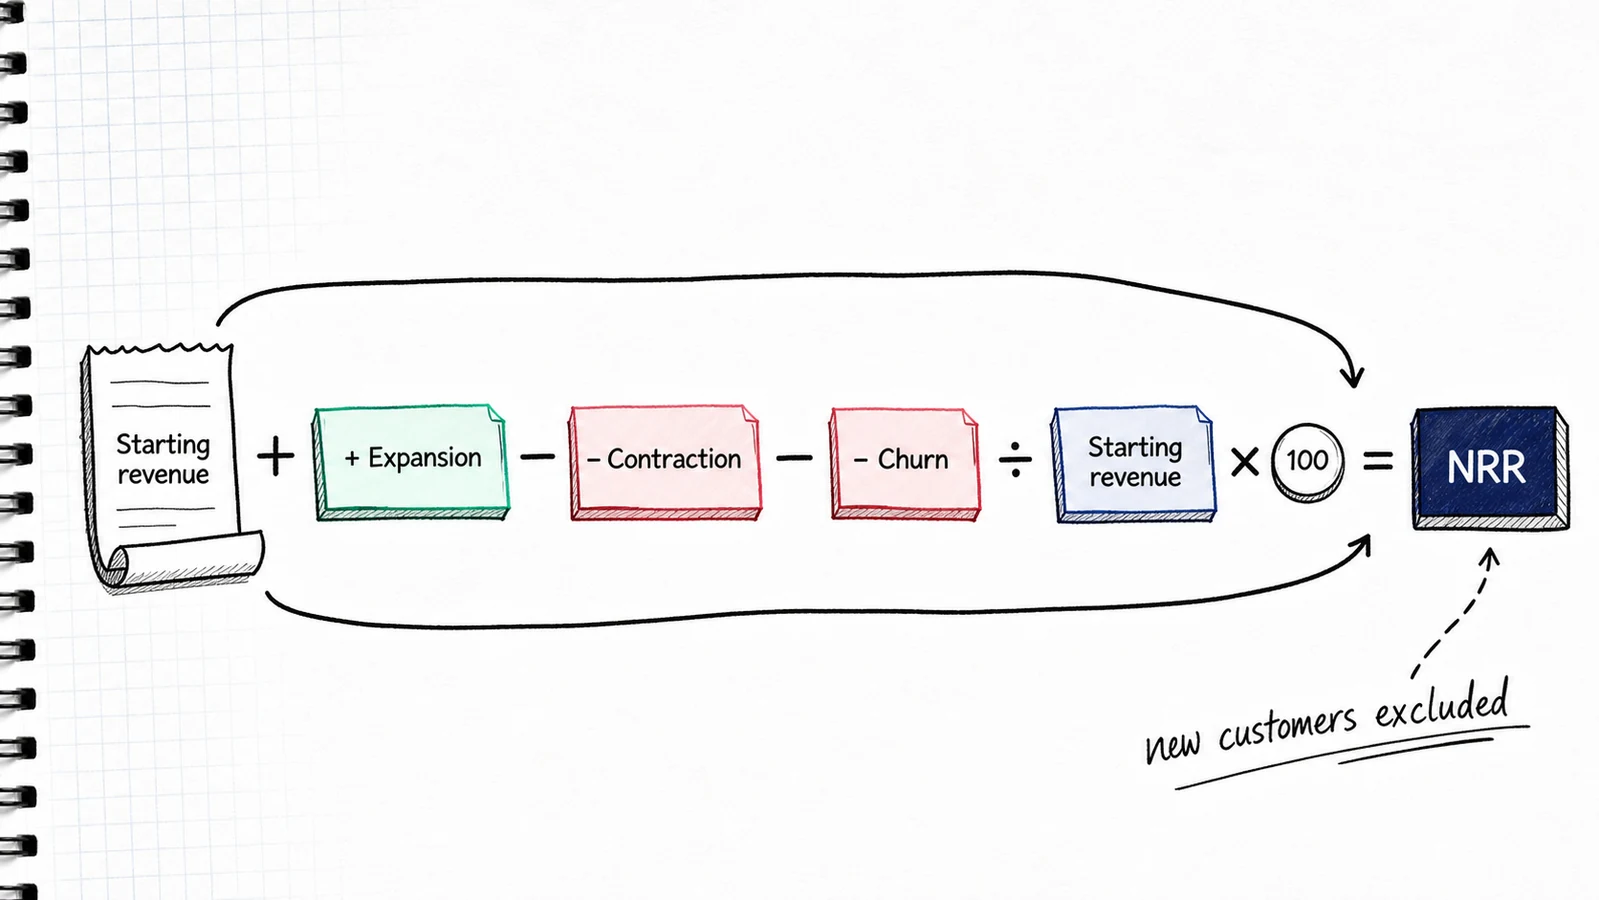
New customers are excluded because NRR measures the existing base. The same customer definitions, currency rules, and period boundaries should be maintained by RevOps and finance.
Companies may calculate NRR by segment, plan, region, cohort, or customer size. A blended company average can hide a healthy enterprise segment and a weak self-serve segment.
Cohort boundaries must stay unchanged throughout the measurement period.
SaaS example
Suppose a cohort starts with $100,000 MRR. During the year, it adds $15,000 through expansion, loses $5,000 through contraction, and loses $8,000 through churn.
NRR is 102%: the cohort ends with $102,000 recurring revenue before any new customers are counted.
In a product-led growth business, collaboration, usage depth, and feature adoption may explain expansion. Weak activation may explain later contraction or churn.
Common mistakes
The first mistake is including new customer revenue.
The second mistake is changing the cohort during the measurement period.
The third mistake is mixing customer retention and revenue retention.
The fourth mistake is reading blended NRR without segment-level context.
How we see it
NRR shows whether the existing customer base compounds or erodes. It is strongest when the company can explain which customer behaviors and product outcomes caused the number to move.
Pair NRR with gross revenue retention and cohort context. Expansion from a few large accounts can conceal broad contraction elsewhere. Segmenting by customer size, product, and start period reveals whether retention quality is durable. Use the same opening cohort and currency treatment in every comparison, and investigate the expansion and loss events beneath the percentage. Keep the reporting window consistent.