


Gross revenue retention
Gross revenue retention, or GRR, is the percentage of recurring revenue a company keeps from an existing customer cohort after churn and contraction. Expansion revenue and revenue from new customers are excluded.
GRR is also called gross dollar retention. It answers a narrow question: how much of the recurring revenue present at the start of a period remained before upsells, cross-sells, added seats, or usage growth were counted?
The standard formula is:
GRR = (starting recurring revenue – contraction – churn) / starting recurring revenue x 100
Under this formula, GRR cannot exceed 100%.
Why it matters
Expansion can conceal losses. A company may report strong NRR because a small group of customers bought more, even while other customers downgraded or left.
GRR removes that expansion effect. It shows how much recurring revenue the existing base retained at the original or reduced spend level. That makes it useful for reviewing product value, customer fit, contract stability, and revenue leakage.
GRR and customer churn rate should be read together. Customer churn counts lost accounts. GRR weights the loss by recurring revenue, so one large cancellation can change GRR more than several small cancellations.
How it works
Choose an opening customer cohort and record its starting MRR or ARR. Do not add customers acquired after the period begins.
Next, subtract contraction from customers who stayed but reduced their recurring spend. Contraction can come from downgrades, fewer seats, lower usage, or removed products. The company should document how credits, pauses, and pricing changes are classified.
Then subtract recurring revenue lost when customers churn.
Expansion is left outside the GRR calculation. Reactivation is also normally excluded because it adds recurring revenue back after a loss event. The reactivation rule should remain consistent across reports.
GRR should be compared across the same period, currency basis, customer definition, and revenue basis. A monthly MRR calculation and an annual ARR calculation are not directly comparable without aligned rules.

SaaS example
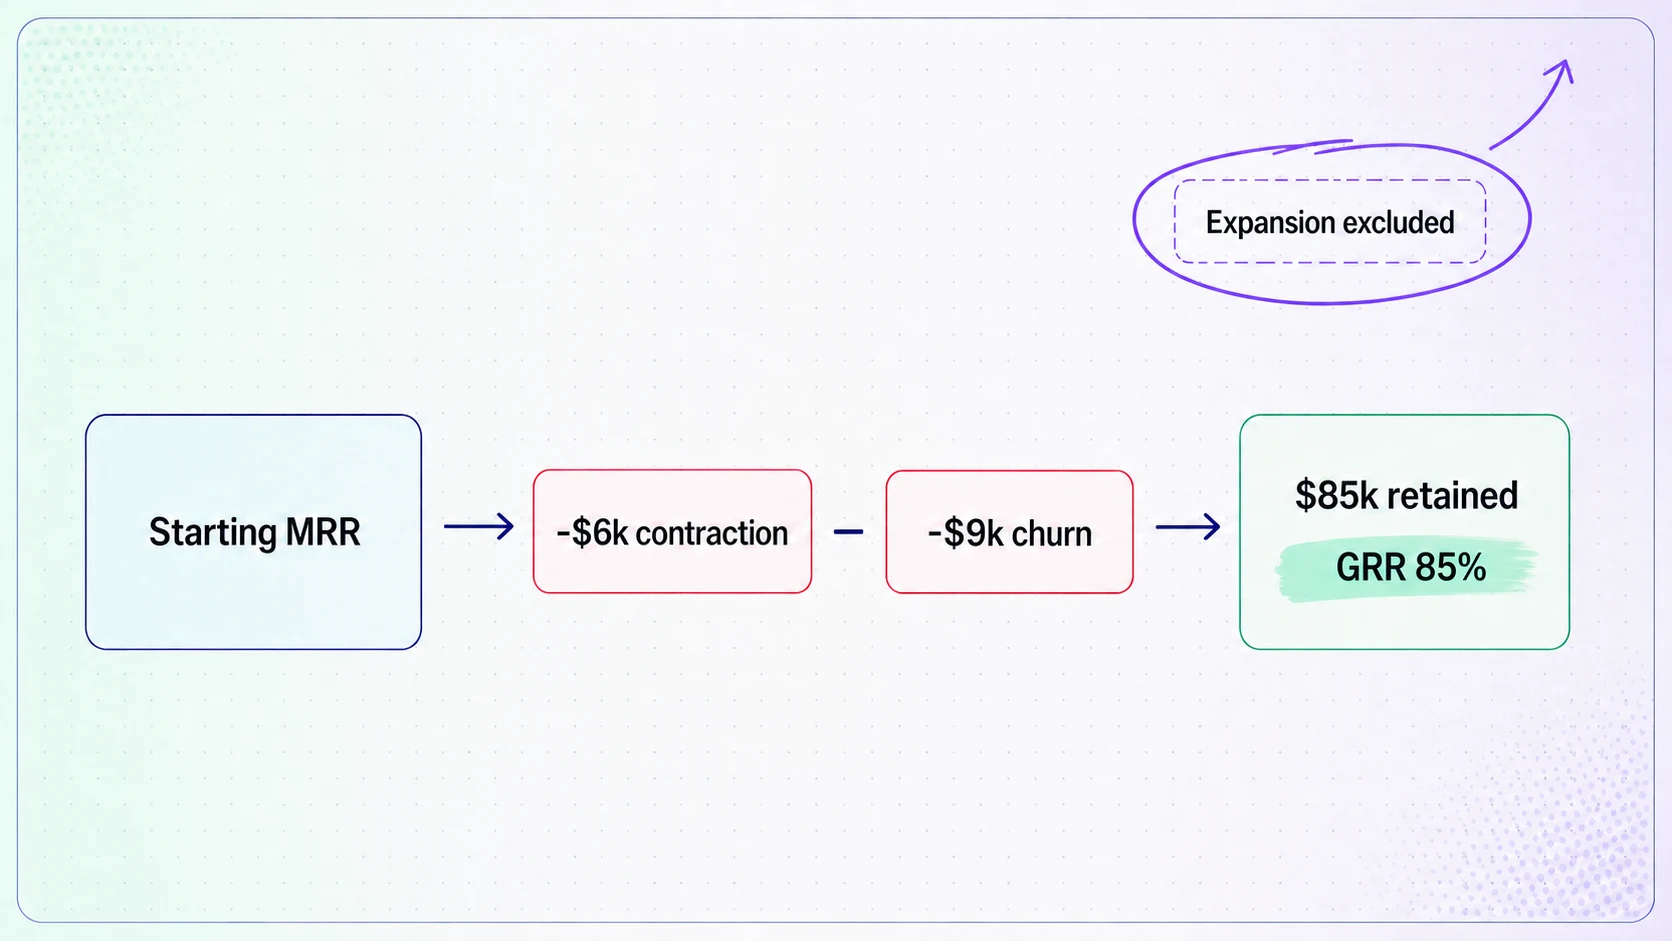
A SaaS cohort starts the month with $100,000 MRR. During the month, existing customers reduce spend by $6,000 and canceled customers remove another $9,000.
GRR is 85%:
($100,000 – $6,000 – $9,000) / $100,000 x 100 = 85%
Suppose the same cohort also produces $20,000 in expansion MRR. GRR remains 85% because expansion is excluded. NRR becomes 105% after the expansion is added.
The pair reveals two conditions at once. The cohort lost 15% of its opening recurring revenue, while growth from other existing customers more than replaced that loss.
Common mistakes
The first mistake is adding expansion to GRR.
The second is including revenue from newly acquired customers.
The third is changing the opening cohort during the period.
The fourth is mixing MRR in the numerator with ARR in the denominator.
The fifth is treating every revenue decrease the same way. Downgrades, temporary credits, usage changes, pauses, and cancellations need stable movement rules.
The sixth is using GRR alone to diagnose why revenue was lost. The percentage identifies the amount retained. Product usage, customer segment, contract history, support evidence, and exit reasons explain the pattern.
How we see it
GRR is the cleaner test of whether the installed revenue base is holding. NRR shows the combined effect of retention and expansion. Both belong in the review, but they should not answer for each other.
RevOps and finance should own a shared movement dictionary so contraction, churn, reactivation, and expansion reconcile from account records to the reported percentage. Read GRR by segment and cohort, then inspect the events beneath any change. A blended result can hide strong retention in one customer group and severe leakage in another.
Get practical retention and SaaS metric breakdowns in the GTMpreneur newsletter.