


Churn rate
Churn rate is the percentage of a starting customer or recurring-revenue base that is lost during a defined period. In SaaS, teams usually track customer churn, which counts lost accounts, and revenue churn, which counts lost recurring revenue.
The basic customer churn formula is:
Customer churn rate = customers lost during the period / customers at the start of the period x 100
The unit and period must be named with the result. A 4% monthly customer churn rate and a 4% annual revenue churn rate answer different questions.
Why it matters
Acquisition can make total customer count or MRR rise while the existing base is weakening. Churn isolates the loss side of the customer system.
Customer churn shows how many accounts leave. Revenue churn shows how much recurring value leaves with them. The two rates can move differently when account sizes vary. Losing one large customer may barely change logo count while removing a material share of revenue.
Churn also affects LTV and the amount a company can sensibly spend on CAC. If customers leave before acquisition cost is recovered, new sales create activity without building a durable revenue base.
How it works
Start by choosing the unit. Use customer accounts for customer churn. Use recurring revenue for revenue churn.
Next, choose a reporting period and freeze the opening population. Customers acquired after the period begins do not enter that opening denominator.
Then define the loss event. A customer may count as churned on cancellation, contract expiry, failed renewal, or the end of a grace period. Revenue churn may include canceled revenue, contraction from downgrades, or both. The reporting rule should say which events count.
Finally, calculate the loss against the starting base:
Gross revenue churn rate = recurring revenue lost under the stated rule / recurring revenue at the start of the period x 100
Keep the same event rules and time window across comparisons. Monthly churn should not be multiplied by 12 and treated as an exact annual churn rate because losses compound against a changing base.

SaaS example
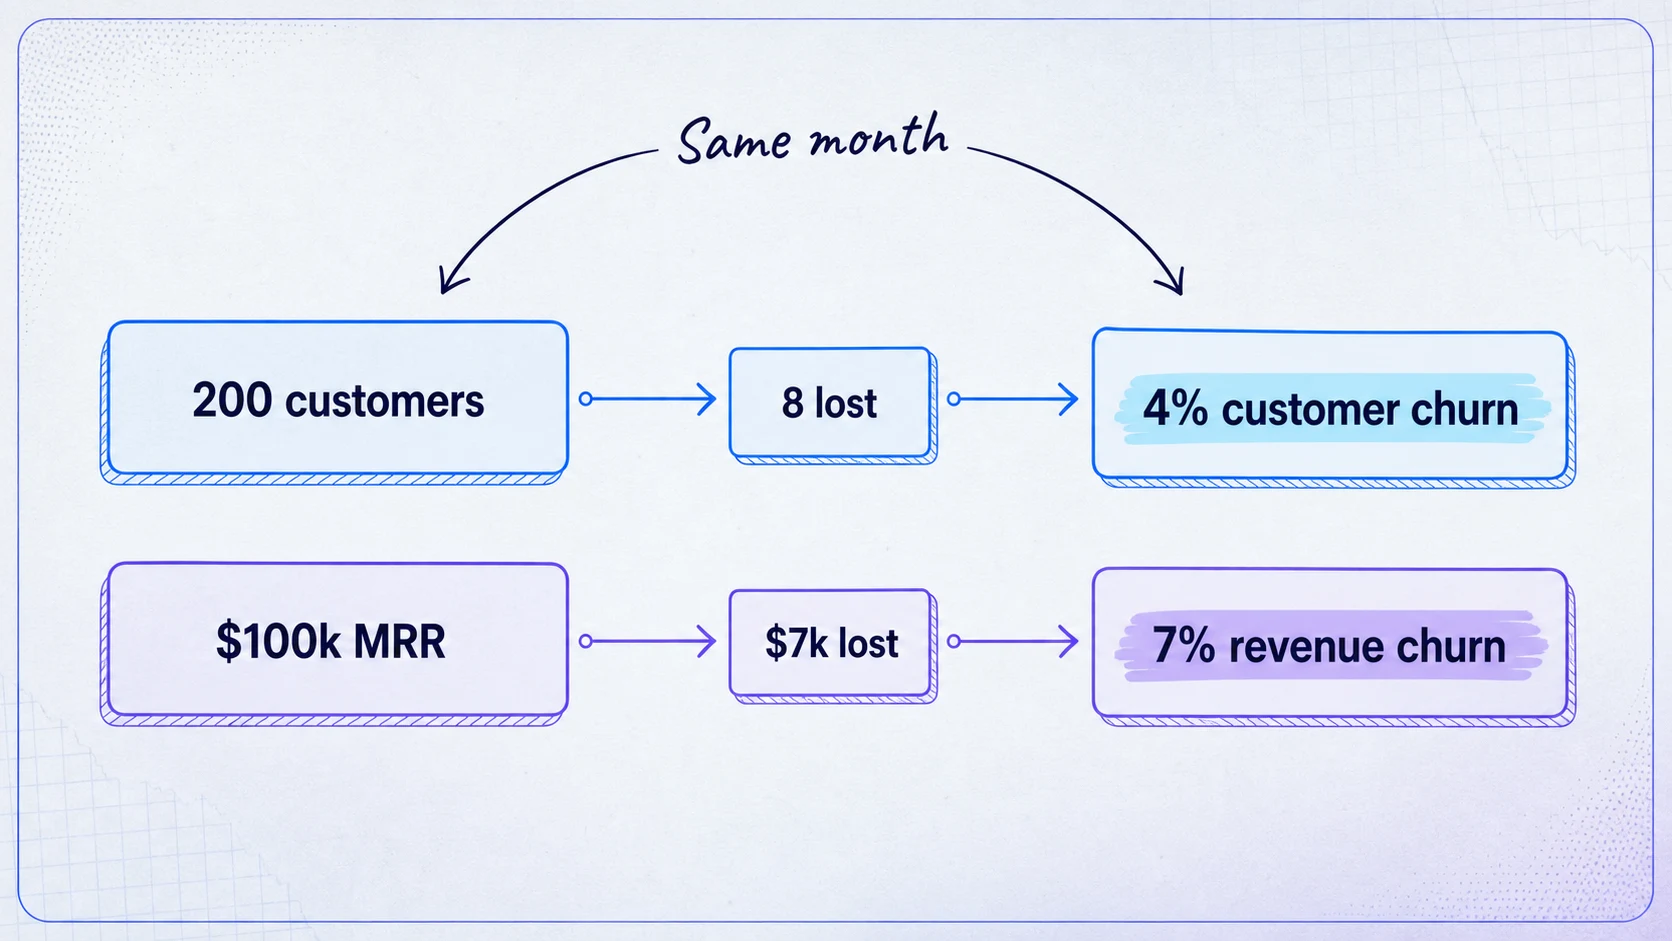
A SaaS company starts a month with 200 customers and $100,000 MRR. Eight customers leave, so customer churn is 4%.
Those cancellations and downgrades remove $7,000 MRR. Under a gross revenue churn rule that includes both events, revenue churn is 7%.
The gap shows that the lost accounts carried above-average revenue. Looking only at customer churn would understate the commercial impact. Looking only at revenue churn would hide how widely the loss was distributed across accounts.
The same split helps explain NRR. NRR adds expansion from the opening customer cohort, while gross churn keeps attention on recurring revenue lost.
Common mistakes
The first mistake is reporting “churn” without naming the unit.
The second is dividing lost customers by the ending customer count or by every customer touched during the period.
The third is changing cancellation, pause, non-renewal, and reactivation rules between reports.
The fourth is comparing blended churn across different customer segments. An enterprise motion and a product-led growth motion can have different contract lengths, account values, and loss patterns.
The fifth is assigning a cause from the percentage alone. Churn identifies loss. Product usage, support history, pricing changes, account fit, and exit feedback help explain it.
How we see it
Churn is useful only when the calculation can be audited back to a starting population, a loss event, and a period. A single percentage without those choices is difficult to compare and easy to misread.
Track customer and revenue churn together, then segment them by plan, account size, acquisition source, or start cohort. The total tells you how much left. The segment and event data show where the loss is concentrated and which operating decision deserves attention.
Get practical retention and SaaS metric breakdowns in the GTMpreneur newsletter.