


MRR
MRR means monthly recurring revenue. It is the normalized monthly value of active recurring subscriptions and contracts.
MRR converts different billing cycles into a common monthly view. An annual subscription is divided by 12, while a quarterly subscription is divided by three.
One-time fees, implementation projects, hardware, and non-recurring services are normally excluded.
Why it matters

MRR gives SaaS companies a sensitive view of recurring revenue momentum. It can show changes from new customers, upgrades, downgrades, cancellations, and reactivations as they occur.
That makes it useful for operating reviews, forecasting, product decisions, pricing, and customer-success planning. ARR provides the annualized view, while MRR makes recent movement easier to see.
MRR is not recognized accounting revenue. It is a subscription operating metric, so billing and finance definitions must remain consistent.
How it works
The company first normalizes every active recurring subscription into a monthly amount and sums the total.
It can then build an MRR waterfall:
- New MRR from newly acquired customers.
- Expansion MRR from upgrades, more seats, or added products.
- Reactivation MRR from returning customers.
- Contraction MRR from downgrades or reduced usage.
- Churned MRR from canceled customers.
The mix beneath MRR changes as a subscription company grows, even when the closing balance uses the same formula. ChartMogul's MRR movement benchmark used anonymized platform data from December 2021 through February 2022. New business supplied 77.7% of MRR added for companies below $10,000 MRR and 50.7% for companies above $1 million MRR. At the larger band, expansion supplied 36.1% and the remaining 13.2% was reactivation. The study reports composition, not evidence that scale itself caused the mix to change.
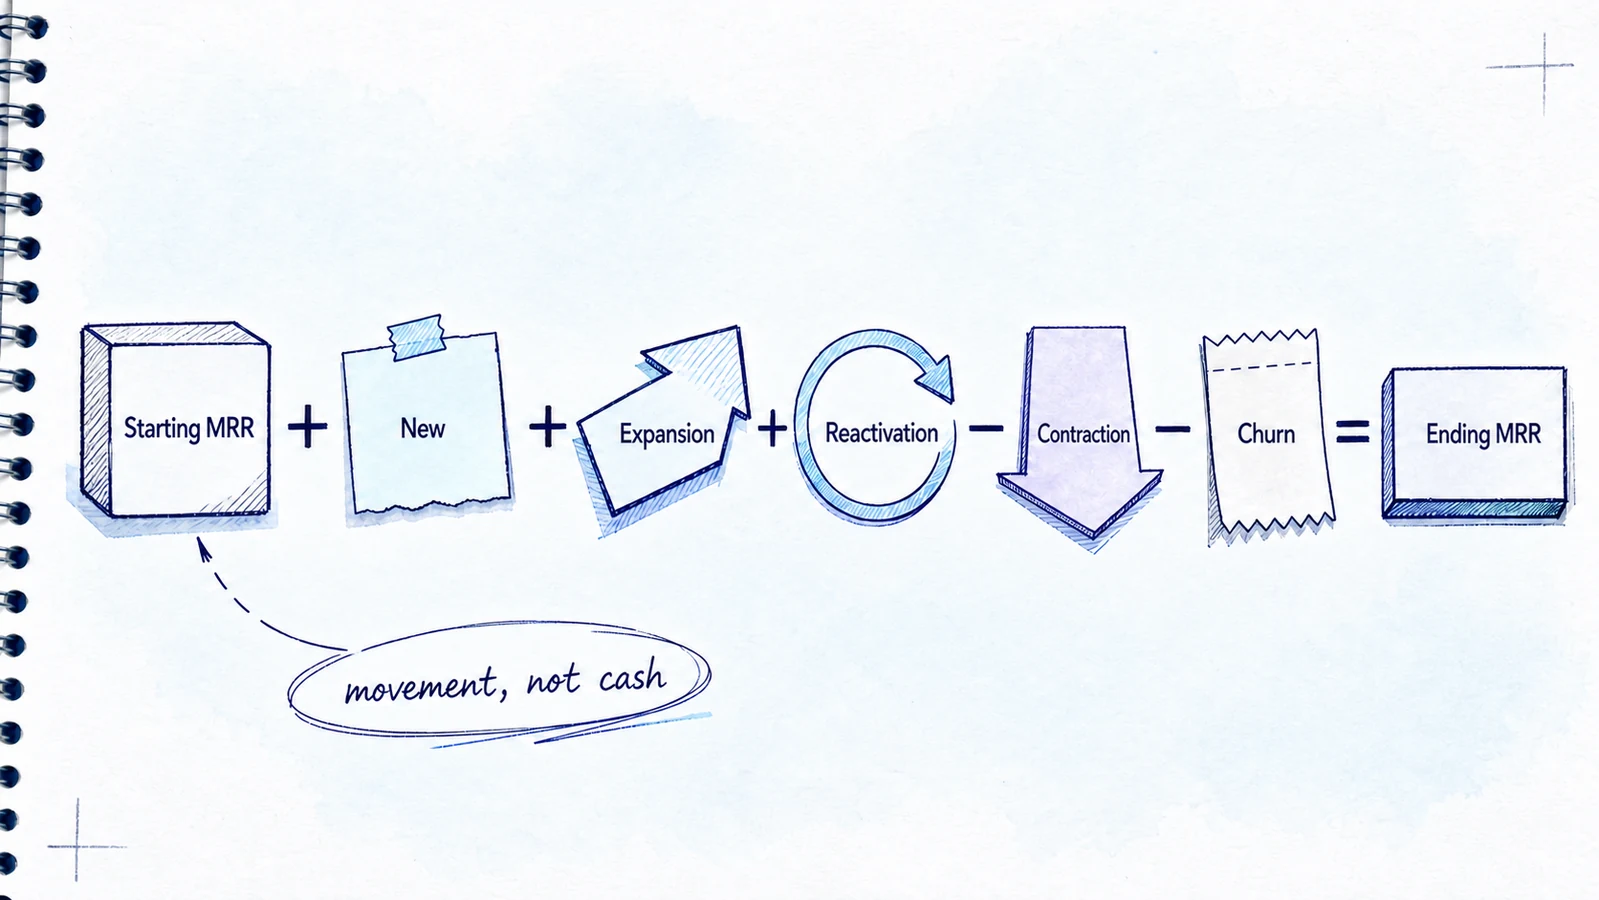
The relationship is:
Ending MRR = starting MRR + new + expansion + reactivation – contraction – churn
Annual and multi-year payments should be normalized across their service period. Cash received upfront does not become one month of MRR.
The company should document how discounts, pauses, credits, and usage commitments enter the monthly calculation.
SaaS example
Suppose a company starts the month with $100,000 MRR. It adds $8,000 new MRR, $4,000 expansion, and $1,000 reactivation. It loses $2,000 through contraction and $3,000 through churn. Ending MRR is $108,000.
That movement should be compared with CAC, LTV, and NRR. Growth driven by expensive acquisition may look different from growth driven by retention and expansion.
In a product-led growth motion, product usage may explain which actions precede expansion or churn.
Common mistakes
The first mistake is including one-time revenue.
The second mistake is recording annual payments in a single month.
The third mistake is excluding discounts or contract changes inconsistently.
The fourth mistake is reporting total MRR without showing the components that moved it.
How we see it
MRR is useful because it turns recurring revenue into a visible monthly system. The total matters, but the additions and losses explain whether the revenue base is becoming healthier.
The closing balance should reconcile to its bridge from the opening balance. New, expansion, contraction, reactivation, and churned MRR need consistent rules so the metric can guide decisions instead of merely filling a dashboard. Segment the bridge by plan, customer size, or acquisition source when the blended total hides what changed. Pair the amount with customer counts to distinguish a few large movements from a broad pattern across the base.