


Sales forecasting methods for B2B SaaS
Sales forecasting methods are structured ways to estimate future bookings, revenue, renewals, or cash from historical results, active opportunities, recurring contracts, and seller input. The right method depends on the target, horizon, available evidence, and decision the forecast must support.
A forecast is useful only when its target is explicit. “Next-quarter sales” could mean signed new-logo contracts, recognized revenue, net-new ARR, renewals, expansion, or cash collected. Those outcomes happen on different timelines and require different data.
Salesforce's current method guide lists approaches ranging from historical and opportunity-stage methods to sales-cycle and multivariable forecasts. A SaaS team should not select one because it sounds advanced. It should select a baseline that fits the target, test it against actual outcomes, and add complexity only when the added evidence improves decisions.
Separate the forecast targets first
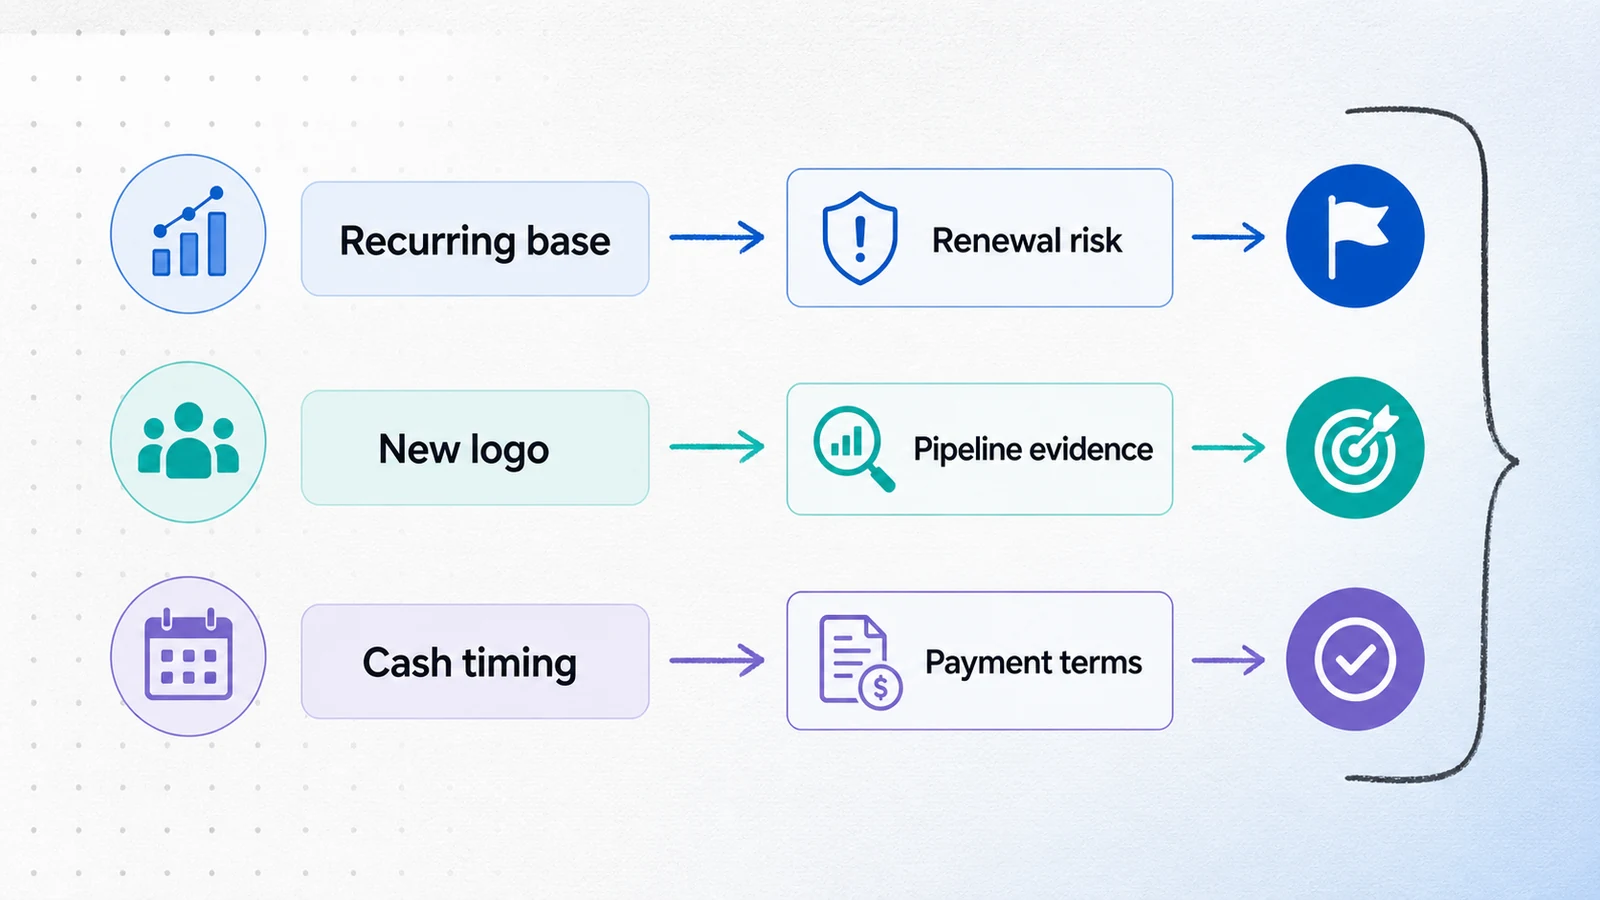
Most B2B SaaS companies need at least three forecast lanes.
Recurring base: Contract schedules, renewal dates, product usage, account health, and known price changes inform expected renewals and expansion. The existing customer base is usually more observable than new-logo demand.
New-logo bookings: The active sales pipeline, opportunity evidence, expected values, cycle times, and seller categories inform the booking forecast. This lane carries more event risk because deals can slip or exit.
Cash timing: Invoice dates, payment terms, implementation conditions, and collection behavior inform cash. A signed annual contract does not always become cash in the same period.
The go-to-market plan should state which target drives hiring, spending, and board communication. One blended number can hide a healthy renewal base and a weak new-logo quarter, or the reverse.
Historical and run-rate forecasting
Historical forecasting projects a future period from prior results. A basic version applies the recent run rate or the same period's result from a previous year, with documented adjustments.
This method is useful when the process is stable, seasonality is understood, and the horizon is short. It creates a naive baseline against which more elaborate methods can be tested.
It fails when a company has changed segment, pricing, sales capacity, product, or acquisition motion. A small SaaS company can also have results dominated by a few large contracts. In that situation, the average hides more than it explains.
Use historical forecasting for the recurring base or a stable transactional motion. Do not use last quarter as the answer simply because it is available.
Opportunity-stage forecasting
An opportunity-stage forecast multiplies the value of each deal by a probability associated with its stage, then sums the weighted values.
Weighted pipeline forecast = sum of opportunity value x stage probability
If a $20,000 opportunity is in a stage with a calibrated 40 percent historical win rate, its weighted contribution is $8,000. That is a calculation, not a prediction that 40 percent of the individual contract will close.
The method is useful when stages have evidence-based boundaries and enough outcomes exist to estimate conversion. The SaaS sales funnel can provide stage-conversion context, but pipeline probabilities should be calculated from comparable opportunities rather than copied from CRM defaults.
This method fails when stage placement is subjective, close dates are stale, or probabilities ignore segment, source, ACV, and cycle differences. Recalibrate probabilities on a defined schedule and preserve enough history to see drift.
Sales-cycle forecasting
Sales-cycle forecasting estimates the likelihood or timing of a close from an opportunity's age relative to comparable completed deals. It can be useful when stage data is inconsistent but cycle patterns are measurable.
The comparison group matters. A 90-day age can be normal for an enterprise security purchase and alarming for a small team plan. Segment by deal type, motion, and value before interpreting age.
Age is also insufficient on its own. A deal with recent buyer activity can be healthier than a younger deal with no agreed next event. Combine cycle position with evidence of momentum.
Rep and manager category forecasting
Category forecasting asks sellers and managers to classify opportunities as pipeline, best case, commit, or a similar set of states. It adds context that a stage model may not capture, including procurement risk, executive alignment, or a known competitive event.
Categories are useful when each one has a shared definition and leaders review how category calls perform. They fail when “commit” means confidence rather than evidence, or when categories are changed late to match the desired number.
Track calibration by owner and category. If one manager's best-case opportunities behave like another manager's pipeline category, the labels are not comparable.
Multivariable forecasting
Multivariable methods combine several predictors, such as stage, age, opportunity value, activity, stakeholder participation, segment, source, and owner history. Statistical or machine-learning models can detect interactions that a single weighted-stage formula misses.
They require enough clean historical outcomes, stable feature definitions, and ongoing monitoring. Missing data is not neutral. If only the most disciplined sellers record stakeholders and next steps, the model may learn rep behavior as a proxy for deal quality.
A disclosed Salesforce survey of 5,500 sales professionals across 27 countries found that only 35 percent completely trusted their organization's data. That global result is not a forecast-accuracy benchmark, but it explains why data governance can constrain model choice.
Use a multivariable method after simpler baselines are measurable. The model should earn its place through lower error or better decision quality.
Renewal and expansion forecasting
Renewal forecasting starts with contracts scheduled to renew, then adjusts for known churn, contraction, expansion, and timing evidence. Cohorts can be grouped by renewal month, segment, product, tenure, or risk condition.
The strongest inputs are often different from new-logo inputs: contracted value, usage trend, unresolved support issues, commercial history, stakeholder change, and explicit renewal steps. Do not force account health into a single universal probability without testing how its components relate to actual renewals.
Finance may need the gross recurring base, expected expansion, expected contraction, and expected churn as separate lines. Combining them too early makes a favorable net number hard to diagnose.
Scenario forecasting
Scenario forecasting produces a small set of internally consistent outcomes, often downside, base, and upside. Each scenario changes named assumptions such as pipeline creation, conversion, cycle time, renewal rate, or hiring date.
It is useful when uncertainty is high or a decision is difficult to reverse. A board plan might use the base case, while hiring approval depends on whether the downside case can support the added cost.
Scenarios should not be arbitrary percentage adjustments. State what changes, why it could change, and which leading signal would indicate that the scenario is becoming more likely.
Forecast by sales capacity
A capacity forecast estimates output from available sellers, ramp time, productivity, territory potential, and expected attainment. It supports hiring and target design more than near-term opportunity inspection.
Capacity models should separate fully ramped sellers, ramping sellers, planned hires, and vacancies. They should also account for the time between hiring, pipeline creation, and closed revenue.
This method is useful for annual planning. It is weak as a short-term substitute for opportunity evidence. A capacity plan can show that the team should produce a number without showing whether the current quarter will produce it.
Combine forecasts when the signals are genuinely different
A combination can average or otherwise reconcile independent methods, such as an opportunity forecast, a historical baseline, and a manager category call. Combining methods can reduce dependence on one model's errors, but combining three versions of the same stage data adds little.
Forecasting: Principles and Practice recommends choosing methods with the available data and the forecasting problem in mind. Its chapter on forecast combinations includes a transparent example using monthly Australian takeaway-food expenditure. In the 2014-2018 test period, the simple combination produced 2.19 percent MAPE, compared with 2.65 for ARIMA, 3.54 for STL-ETS, and 6.66 for ETS.
That example is not B2B SaaS evidence and does not establish a universal winning model. It shows the discipline a sales team should borrow: compare alternatives on held-out actuals before choosing one.

Measure error, not confidence
A forecast process needs at least two views of error.
Signed variance shows direction:
Forecast variance = forecast – actual
A positive result indicates overforecasting under this convention. A negative result indicates underforecasting.
Absolute error shows magnitude without cancellation. Mean absolute error is easy to explain. Weighted absolute percentage error can compare periods of different scale, while MAPE can behave poorly when actual values are near zero.
Use rolling tests when enough history exists. Time-series cross-validation repeatedly trains on earlier observations and evaluates the next period, which is closer to how a live forecast is used than fitting and judging the same data.
Track error by target, horizon, segment, method, and owner where the sample permits. A quarterly forecast may look accurate because renewal predictability cancels new-logo overforecasting. Separate the lanes before celebrating the total.
Choose a method with five decisions
- Name the target. Bookings, ARR, revenue, renewals, expansion, or cash.
- Set the horizon. Weekly inspection, monthly close, quarter, or annual capacity.
- List available evidence. Historical outcomes, pipeline stages, cycle data, contract schedules, seller input, and external constraints.
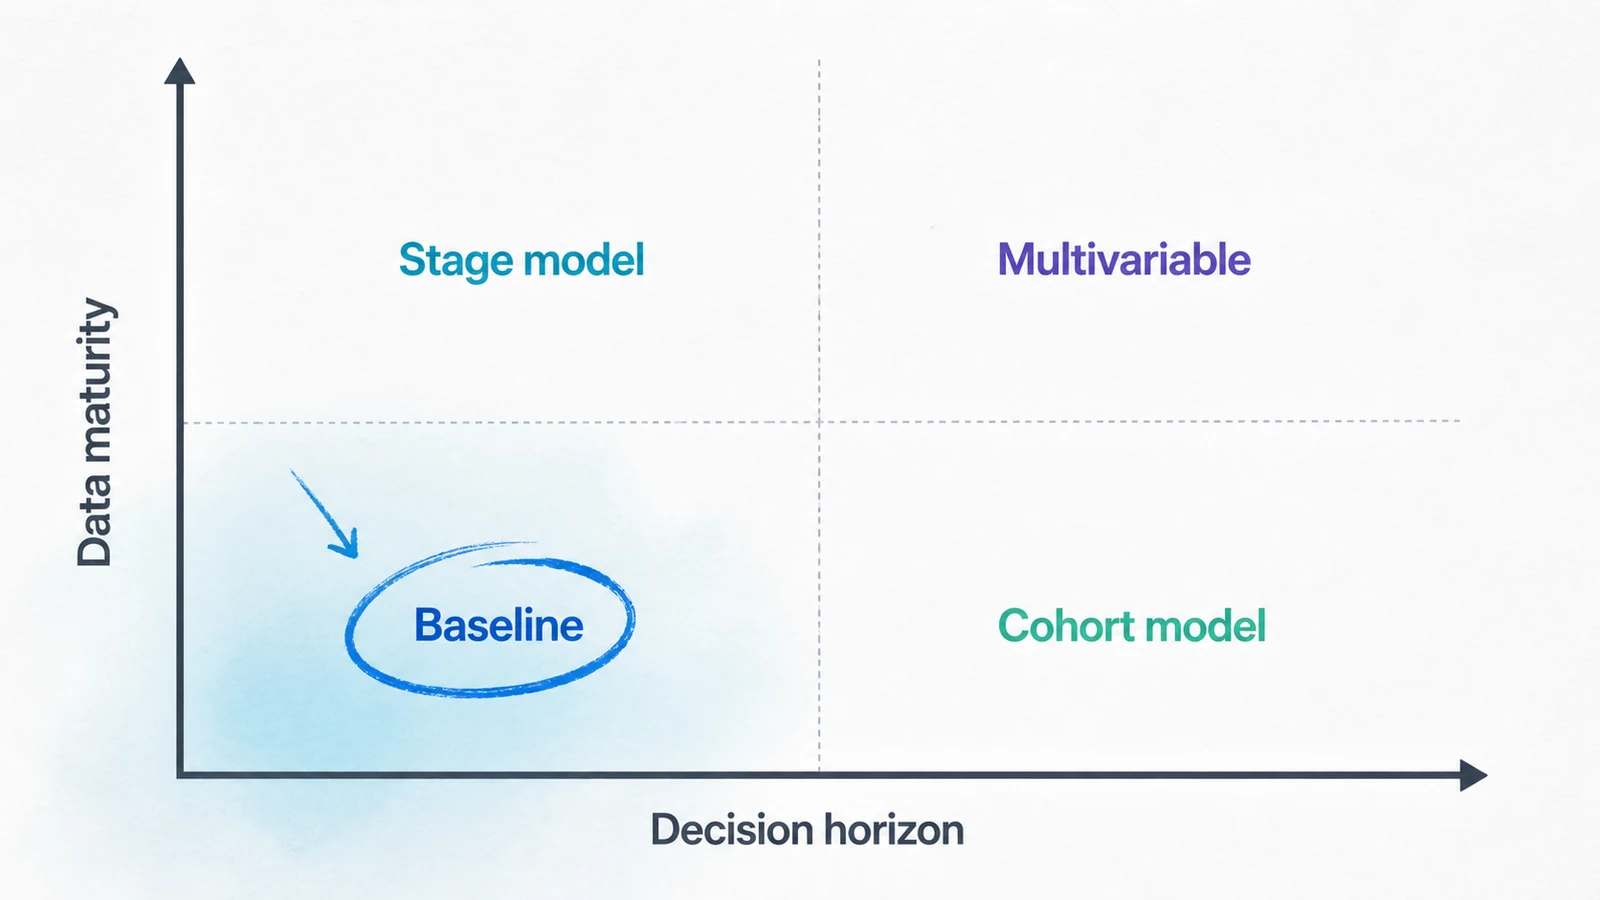
- Choose a baseline and backtest. Start simple and record error.
- Add only useful complexity. Retain a new signal when it improves held-out error or a named decision.
Clari's forecasting guide correctly emphasizes process and inspection alongside the number. The transferable point is that a forecast must have owners, update rules, and review decisions. Software cannot define those choices for the team.
RevOps can own definitions, data quality, method evaluation, and the forecast calendar. Sales leaders own opportunity calls and interventions. Finance owns the connection between bookings, revenue, cash, and planning.

Start small when historical data is sparse
An early founder-led sales motion can start with three numbers: contracted recurring base, named opportunities with explicit evidence, and a downside/base/upside range. Record the assumption behind every material opportunity and compare it with the outcome.
After several periods, calculate basic stage conversion, cycle length, slippage, and signed error. Do not train a complex model on a handful of inconsistent deals. The first goal is a comparable history.
Common forecasting mistakes
- Forecasting an undefined target
- Mixing renewals, new logos, revenue, and cash too early
- Using CRM default probabilities without calibration
- Judging a model on the same data used to fit it
- Adding variables before establishing a baseline
- Letting confidence categories replace evidence
- Reporting one total that hides segment errors
- Changing the method without preserving an error history
Frequently asked questions
What is the most accurate sales forecasting method?
No method is most accurate in every setting. Accuracy depends on the target, horizon, data quality, sample size, process stability, and evaluation method. Compare suitable baselines against actual outcomes.
How do you calculate a weighted pipeline forecast?
Multiply each opportunity's value by a calibrated probability for its stage or evidence state, then sum the weighted values. Recalculate probabilities from comparable historical outcomes rather than CRM defaults.
How often should a SaaS sales forecast be updated?
Update it as quickly as material evidence changes and the team can act. Many B2B teams update weekly and inspect more frequently near a period close. Recurring-base forecasts may follow a different cadence.
What is a good sales forecast accuracy rate?
There is no context-free target. Establish a baseline for each forecast horizon and target, then track signed and absolute error over time. The direction and business cost of the error also matter.
Can a startup forecast sales without much historical data?
Yes, but it should use ranges and explicit assumptions. Start with contracted revenue, named opportunities, cycle evidence, and scenarios. Build a consistent outcome history before adding a complex model.
Establish the baseline now
Choose one forecast target and calculate the simplest credible baseline for the next closed period. When actuals arrive, record the signed and absolute error. That record is the starting point for selecting a better method.