


Average revenue per account
Average revenue per account, or ARPA, is the average recurring revenue generated by each paying customer account during a period. A monthly SaaS calculation usually divides monthly recurring revenue by the number of paying accounts.
ARPA uses accounts as the denominator. ARPU uses individual users, while some analytics products use the terms interchangeably. B2B teams should state the unit because one account can contain many seats or users.
Why ARPA matters
ARPA helps a company see how customer mix and monetization change. If MRR rises faster than the number of paying accounts, ARPA rises. That may reflect larger new customers, upgrades, price changes, or the loss of smaller accounts.
The metric also shapes the GTM motion. A low-ARPA self-serve product needs efficient acquisition and support. A high-ARPA product can support more sales effort, onboarding, and account management. The average alone does not choose the motion, but it makes the economic constraint visible.
How ARPA works
For monthly ARPA, use:
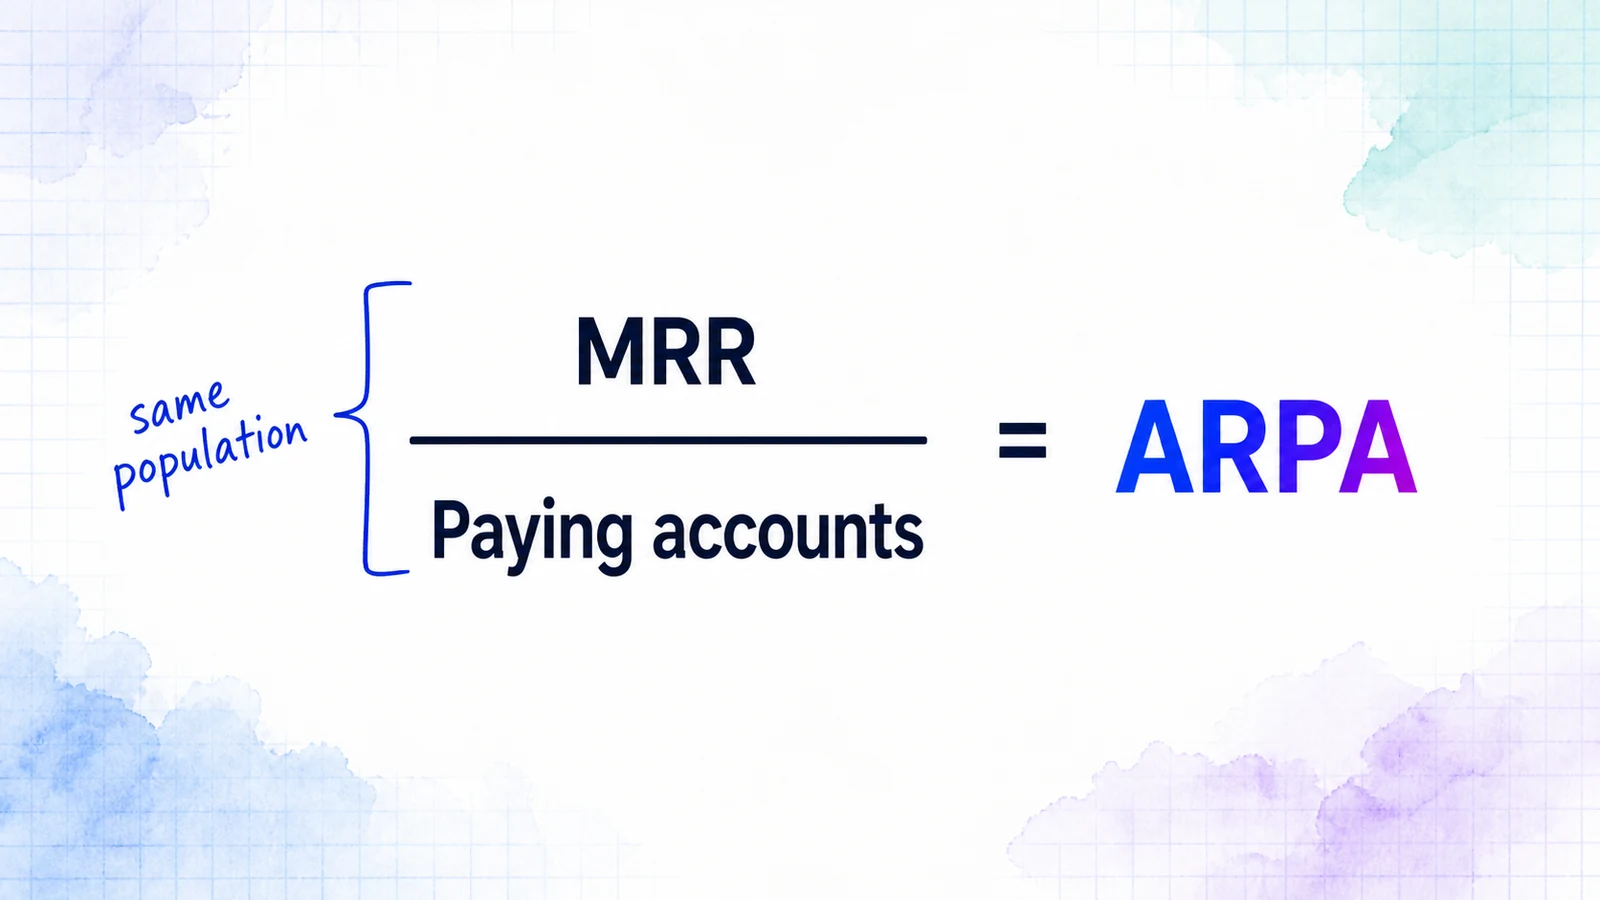
Monthly ARPA = MRR / Paying customer accounts
The numerator and denominator must describe the same population and date. If MRR excludes free plans, the account count must exclude them too. Decide how to treat trials, past-due subscriptions, credits, usage revenue, and customers with multiple subscriptions.
Segmented ARPA is usually more informative than one blended number. Calculate it by plan, customer size, acquisition channel, or region to see whether a change comes from pricing or customer mix.
Track the underlying account count beside the ratio. Averages can move sharply when the denominator is small or concentrated.
ARR can be divided by paying accounts for an annualized view. Keep the time basis visible so monthly and annual values are not compared directly.

SaaS example
A SaaS company has $120,000 in MRR from 400 paying customer accounts. Its monthly ARPA is $300.
The next month, MRR rises to $132,000 while the account count stays at 400. ARPA rises to $330. The change could come from upgrades or a price increase. The metric shows the outcome but not the cause, so the team should inspect expansion, contraction, new accounts, and churn separately.
ACV describes annualized contract value, often for a new or specific contract. ARPA describes the average recurring revenue across the active account base. LTV estimates value across the customer relationship. These metrics should not be substituted for one another.
Common mistakes
The first mistake is dividing by users when the company sells to accounts. Seat growth can then lower ARPU while account economics remain unchanged.
The second is including one-time services in one month and comparing the result with recurring-only months.
The third is reading a rising ARPA as automatic improvement. ARPA can increase because many small customers churned, which may leave total growth weaker and revenue more concentrated.
We use ARPA as a mix indicator, not a standalone score. Pair it with account growth, retention, expansion, and segment data. That combination shows whether the company is moving upmarket deliberately or simply averaging over a customer base that changed for less desirable reasons.