


Sales forecast accuracy
Sales forecast accuracy measures how closely forecast revenue matches actual revenue for the same period. It tells a team whether its forecast process produces a dependable estimate, not whether the team hit its sales target.
A forecast can be inaccurate even when revenue exceeds target. It can also be accurate when the team misses target, provided the forecast predicted that miss correctly.
Why sales forecast accuracy matters
Leaders use the forecast to make hiring, cash, capacity, and pipeline decisions. A forecast that repeatedly overstates likely revenue can cause premature spending. One that consistently understates revenue can leave the company short on delivery capacity.
Accuracy also reveals whether the sales pipeline is being interpreted consistently. If every rep applies a different meaning to commit, best case, or pipeline, the aggregate forecast carries those differences forward.
The useful question is not whether a single forecast landed perfectly. It is whether errors become smaller, less biased, and easier to explain over several periods.
How sales forecast accuracy works
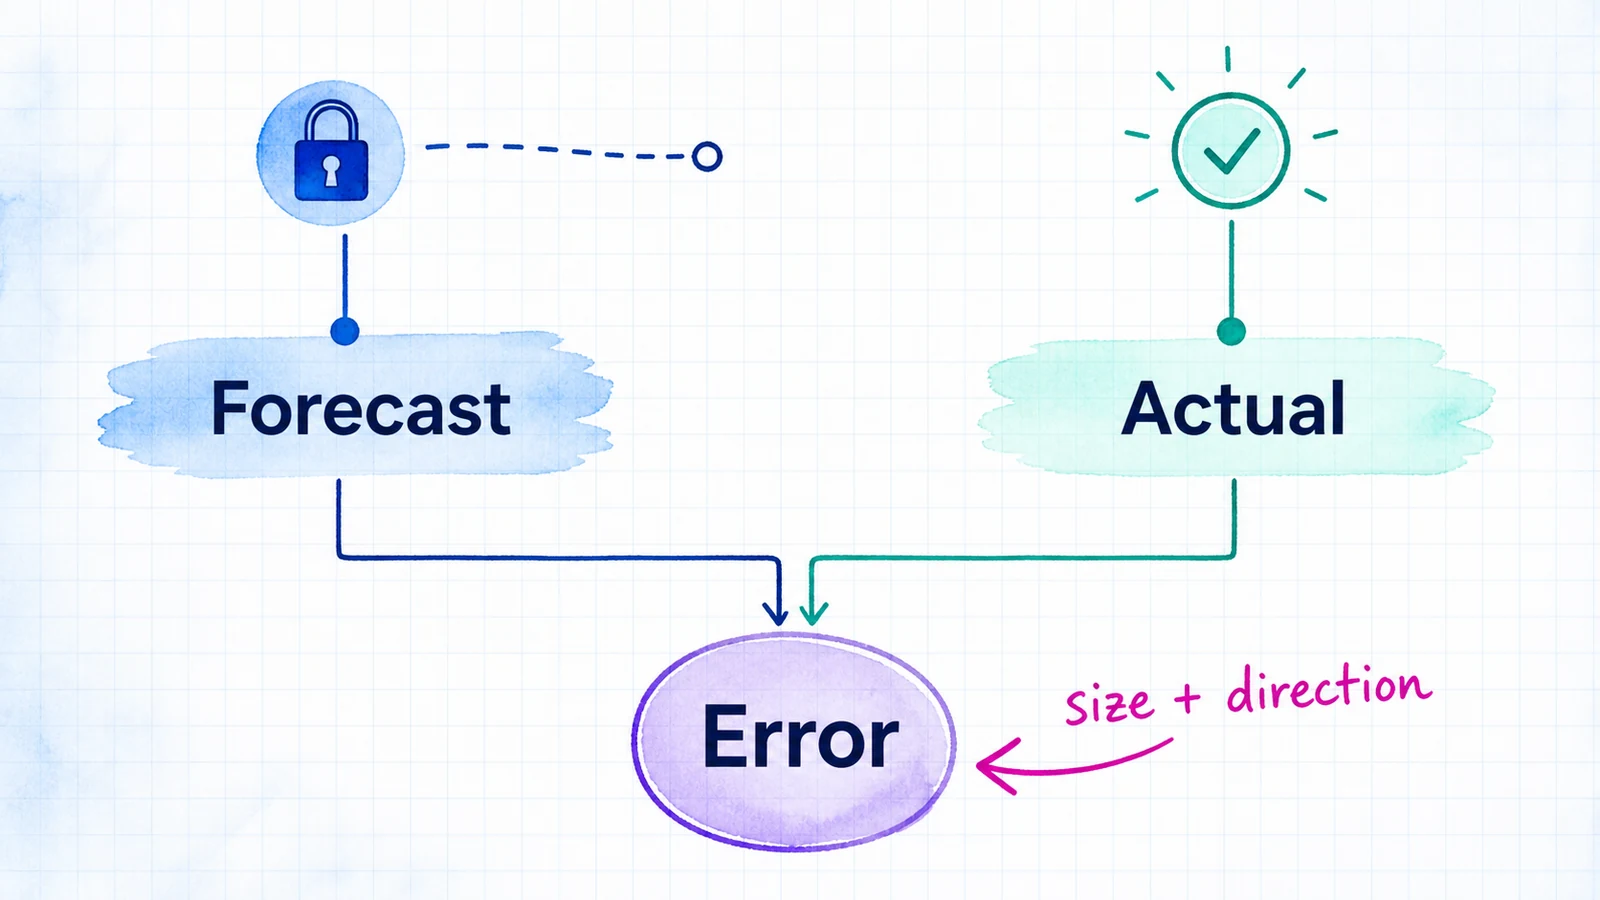
Start by freezing a forecast at a defined checkpoint. Compare that number with actual closed revenue when the period ends. Both numbers must use the same currency, period, revenue definition, and ownership rules.
One simple calculation is:
Forecast error = Forecast revenue - Actual revenue
You can convert the absolute error into a percentage of actual revenue to compare periods of different sizes. Keep the direction as a separate field. A positive error shows overforecasting, while a negative error shows underforecasting.
Reviewing only the absolute percentage hides bias. A team that misses by 10% high every quarter has a different process problem from one that alternates between 10% high and 10% low.
RevOps should also track accuracy by forecast category, rep, segment, and forecast checkpoint. That makes the metric useful for diagnosis rather than turning it into one company-wide score.

SaaS example
A SaaS team freezes a quarterly forecast of $900,000 in new annual contract value. The quarter closes at $810,000. The forecast error is $90,000, or about 11.1% of actual revenue, and the direction is overforecast.
The team then inspects the gap. Two enterprise deals marked commit slipped because procurement had not approved the contracts. The correction is not simply to lower every future forecast. It is to tighten the evidence required before a deal enters commit and reflect that rule in the sales forecasting methods guide.
Common mistakes
The first mistake is confusing forecast accuracy with quota attainment. Quota compares actual performance with a target. Accuracy compares an earlier estimate with the final result.
The second is changing the forecast after the checkpoint and then grading the revised number. That removes the decision context the metric is supposed to test.
The third is averaging percentage errors without preserving direction. Overforecasting and underforecasting can cancel each other numerically while the operating risk remains.
We believe accuracy should be treated as feedback on the forecasting process, not a score used to punish honest estimates. When teams are penalized for calling risk early, they learn to hide uncertainty. The forecast then becomes less useful precisely when the company needs it most.