


Pipeline coverage
Pipeline coverage compares the value of qualified open opportunities with the revenue target for the same period. It answers a practical question: does the team have enough real pipeline to support the number it needs to close?
The basic formula is:
Pipeline coverage = qualified open pipeline / revenue target
If a team has $1.5 million in qualified pipeline against a $500,000 quarterly target, it has 3x coverage. That ratio describes quantity. It does not prove that the quarter will close at $500,000.
Why it matters
Pipeline coverage gives sales leaders and RevOps an early view of a possible revenue gap. Closed-won revenue reports the result after deals finish. Coverage can show that the team needs to create more pipeline while there is still time to respond.
The number also forces a useful distinction between activity and opportunity quality. Meetings, leads, and early interest do not belong in the numerator unless they meet the team's definition of a qualified sales pipeline opportunity.
A high ratio can still be weak. Stalled deals, unsupported close dates, and opportunities created too late to finish in the quarter can make coverage look healthier than it is.
How it works
Start with the target and the exact period. Then total the value of qualified, active opportunities that can reasonably close within that period.
The starting coverage target comes from historical conversion. A team that wins 25% of opportunities from a defined qualified stage needs about four dollars of matched pipeline for each dollar of target. A team that wins 50% from the same stage starts closer to two.
That calculation only works when the definitions match. If the pipeline numerator begins at SQL, the historical win rate must also begin at SQL. Using late-stage win rate against early-stage pipeline produces false confidence.
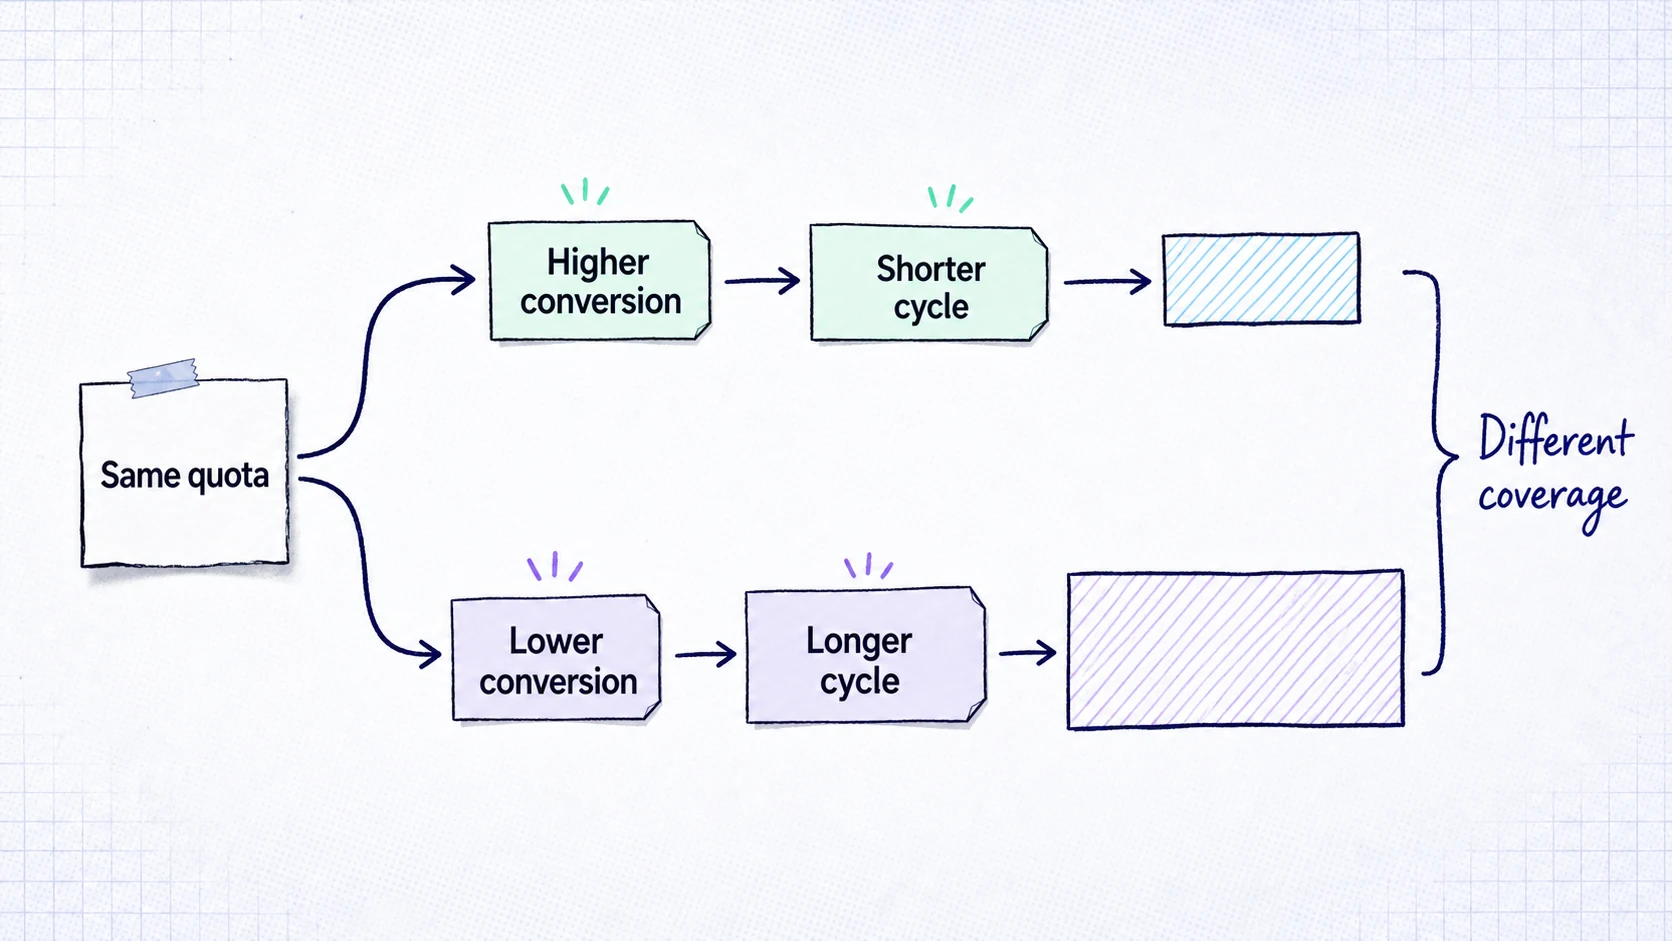
The target should then be examined by segment and timing. Enterprise and SMB motions can have different conversion rates, ACV, sales-cycle lengths, and slippage. Inbound and outbound opportunities may behave differently too. One company-wide multiple can hide those differences.

SaaS example
A SaaS company has a $500,000 new ARR target for the quarter. Its mid-market team wins 25% of opportunities that enter the qualified stage, so the starting requirement is $2 million in pipeline.
The CRM shows $1.6 million, or 3.2x coverage. Two large opportunities cannot complete security review before quarter-end. Once those deals are removed from the in-period calculation, usable coverage falls further.
The response is not to change the stage labels or push close dates forward. The team needs to create qualified pipeline, improve conversion, change the target, or find a credible way to shorten the remaining process.
Common mistakes
The first mistake is treating 3x or 4x as a universal answer. The correct starting point comes from the team's own matched conversion rate.
The second is counting every open deal. Pipeline that is unqualified, stale, or outside the close window should not support an in-period target.
The third is using one blended ratio across different segments. Aggregate coverage can conceal a weak enterprise motion behind a healthy SMB motion.
The fourth is confusing coverage with a forecast. Coverage measures whether enough opportunity value exists. Forecasting estimates what is likely to close.
How we see it
Pipeline coverage is useful when it makes assumptions visible. The ratio should show which stage counts, which period matters, what the team historically converts, and whether the remaining deals have enough time to finish.
A clean number built on vague stages is still a vague number. Keep the qualification boundary consistent, separate motions with different economics, and recalculate when conversion or timing changes. That makes coverage a decision input instead of a quota-comfort metric.