


LTV:CAC ratio
LTV:CAC ratio compares the estimated lifetime gross profit from a customer with the cost of acquiring that customer.
The formula is:
LTV:CAC ratio = LTV / CAC
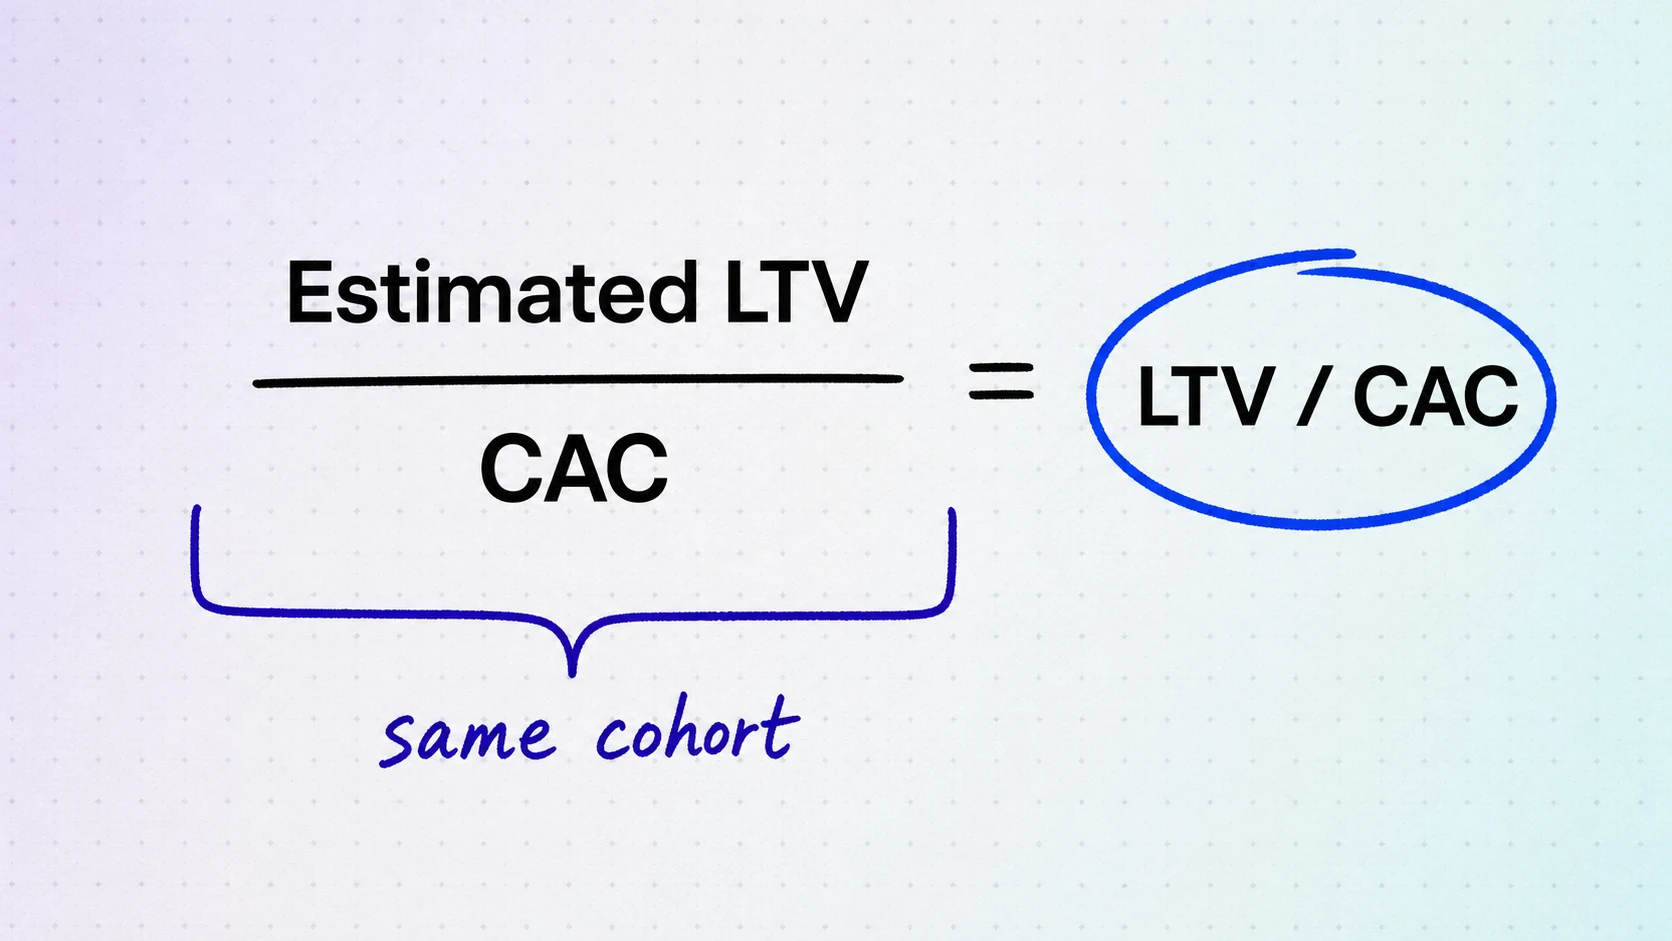
A result of 3.0x means the modeled lifetime value is three times the acquisition cost. It does not mean the company has already collected that value or earned three dollars of accounting profit for every dollar spent.
Why it matters
LTV looks forward across the customer relationship. CAC measures the cost paid to create that relationship. The ratio puts those values on the same scale.
Teams use it to compare segments, channels, and GTM motions. An enterprise segment may support a higher acquisition cost because its customers retain longer or produce more gross profit. A self-serve segment may need lower CAC because each account creates less value.
The ratio is only as useful as its inputs. A precise-looking result can be weak if LTV comes from a short history, CAC excludes salaries, or the two values describe different customer groups.
How it works
First, define one customer cohort or segment. The LTV estimate and CAC calculation should use the same market, product, currency, and acquisition period.
Second, estimate lifetime gross profit. A simplified SaaS formula is:
LTV = average revenue per account x gross margin / customer churn rate
That model assumes revenue and churn remain stable. It can be unreliable when the company has small cohorts, changing prices, uneven retention, or meaningful expansion. Historical cohort gross profit is often more informative when enough data exists.
Third, calculate fully loaded CAC for the matched cohort. Include the sales and marketing costs required to acquire those customers.
Finally, divide LTV by CAC. Track the inputs beside the output so a movement in the ratio can be traced to acquisition cost, margin, retention, or revenue.
NRR can help explain expansion and contraction within the existing customer base, but it should not be inserted into the LTV formula without a defined model.

SaaS example
Suppose a SaaS segment has an estimated LTV of $18,000 and a CAC of $6,000.
$18,000 / $6,000 = 3.0x
Now suppose updated retention data lowers estimated LTV to $12,000 while CAC remains $6,000.
$12,000 / $6,000 = 2.0x
Acquisition efficiency did not change in this example. The ratio fell because the LTV estimate changed. The model should show its retention and gross-margin assumptions instead of reporting only the final multiple.
ACV may help explain revenue differences between segments, but contract value alone does not establish lifetime value.
Common mistakes
The first mistake is treating the frequently cited 3:1 ratio as a universal target.
The second is using lifetime revenue in the numerator while describing the result as lifetime gross profit.
The third is comparing a blended LTV with paid-channel CAC or another mismatched acquisition scope.
The fourth is trusting a long-range LTV estimate built from a short or unstable customer history.
The fifth is reading LTV:CAC without CAC payback. Two segments can have the same ratio and require very different amounts of time and cash to recover acquisition cost.
How we see it
LTV:CAC should be reported as a model with visible assumptions, not as a standalone health score. RevOps and finance should publish the cohort, LTV method, cost scope, gross margin, retention period, and calculation date beside the ratio.
For an early SaaS company, a range is often more honest than one number. Change the retention, margin, and CAC inputs to see where the economics stop working. That sensitivity tells an operator more than matching a borrowed benchmark.